
Review of Gold Data for 2013
This page presents a cursory review of available data pertaining to the gold market.
Summary of 2013 Trend
In 2013, the global gold market is still robust with strong demand in term of tonnage in most countries and sectors.
Between January and September, consumers bought 1,645 tonnes(t) or US$77.29 billion of gold jewellery, as compared to 1,343t or US$72.95 billion in 2012.
The central banks are still increasing their gold reserves and have bought 297 tonnes (US$14.1b), though the rate of purchases has been slowing;
in the same period last year the banks bought 393t (US$20.8b). On the other hand, the investment demand has dropped from 1,110t to 554t, a 50% decrease.
The drop can be contributed by the significant outflow of the gold Exchange-Traded Funds (ETFs), about 697.4 tonnes (US$32.62b) to the open market,
in contrast to the net purchase of 191t in the first nine months of 2012.
Thus, at the end of Q3 the total net demand was 2,805t (estimate US$132b) in 2013, 12% lower of the 2012 figure of 3,188t (est. US$169b),
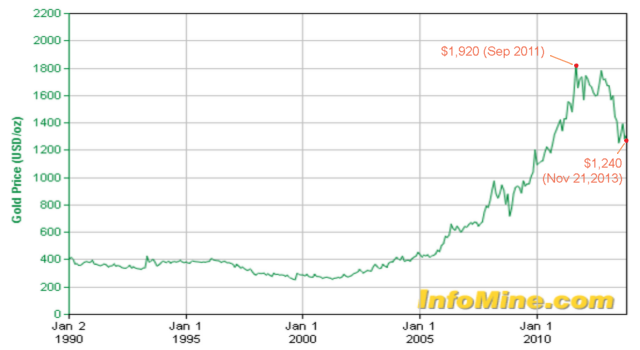
Figure 1a. Gold Price (1999-2013), USD per troy ounce
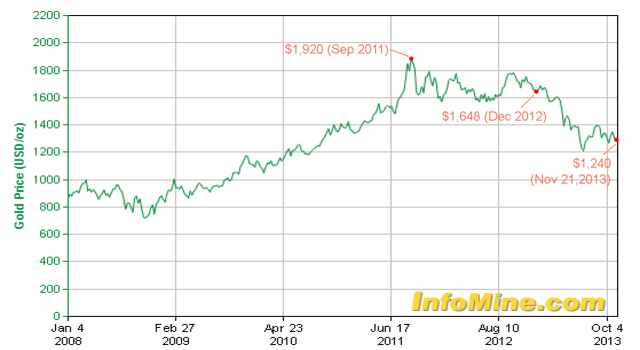
Figure 1b. Gold Price (2008-2013), USD per troy ounce
Middle | Bottom of Page]
Gold Holdings
All above-ground gold held in the world is estimated to range from 155,244 tonnes by James Turk, an investor, to 171,300 tonnes by the annual survey by Thomson Reuters/GFMS. The gold can fit a cube with sides of 20.7m or 68 ft long. The following table lists official data of gold held by governments and international organizations (Table 1).
| 2007 | 2012 | %reserves | 2013-Sep | %reserves | |
| USA | 8,133 | 8,133.5 | 76% | 8,133.5 | 72% |
| Germany | 3,417 | 3,395.5 | 73% | 3,390.6 | 69% |
| Italy | 2,453 | 2,451.8 | 72% | 2,451.8 | 67% |
| France | 2,622 | 2,435.4 | 71% | 2,435.4 | 66% |
| China | 600 | 1,054.1 | 2% | 1,054.1 | 1% |
| Switzerland | 1,166 | 1,040.1 | 11% | 1,040.1 | 9% |
| Russia | - | 957.8 | 9% | 1,015.4 | 8% |
| Japan | 765 | 765.2 | 3% | 765.2 | 3% |
| Netherlands | 604 | 612.5 | 60% | 612.5 | 54% |
| India | - | 557.7 | 10% | 557.7 | 8% |
| Turkey | - | 359.6 | 16% | 499.2 | 16% |
| Taiwan | - | 423.6 | 6% | 423.6 | 4% |
| IMF | - | 2,814.0 | - | 2,814.0 | - |
| ECB | 604 | 502.1 | 33% | 502.1 | 28% |
As of October 2009, gold exchange-traded funds held 1,750 tonnes of gold for private and institutional investors
Mine Production
The top five gold producers were China, Australia, Unites States, Russia and South Africa in 2011 and 2012. This list is expected to be unchanged for 2013. China remains the leading producer with production to reach 430 tonnes at an average cost of US$912/oz, comparing to 403t at $907/oz in 2012
(Source: China Gold Group Corp).
Table 2 shows the half-year production costs in US$/oz of the largest mine company Barrick in the world and
Table 3 shows the annual production of gold producing countries:
Six months ended June 30, 2012 & 2013
| Region | 2013 | 2012 |
| North America | 789 | 850 |
| South America | 765 | 773 |
| Australia Pacific | 1,065 | 1,154 |
| Africa | 1,507 | 1,465 |
| Total | 931 | 1,000 |
Top | Bottom of Page]
| Country | 2011 | 2012* | Reserves |
| United States | 234 | 230 | 3,000 |
| Australia | 258 | 250 | 7,400 |
| Brazil | 62 | 56 | 2,600 |
| Canada | 97 | 102 | 920 |
| Chile | 45 | 45 | 3,900 |
| China | 362 | 370 | 1,900 |
| Ghana | 80 | 89 | 1,600 |
| Indonesia | 96 | 95 | 3,000 |
| Mexico | 84 | 87 | 1,400 |
| Papua New Guinea | 66 | 60 | 1,200 |
| Peru | 164 | 165 | 2,200 |
| Russia | 200 | 205 | 5,000 |
| South Africa | 181 | 170 | 6,000 |
| Uzbekistan | 91 | 90 | 1,700 |
| Other countries | 640 | 645 | 10,000 |
| World Total (rounded) | 2,660 | 2,700 | 52,000 |
Total Supply
| Supply | Q1'11 | Q2'11 | Q3'11 | Q4'11 | Q1'12 | Q2'12 | Q3'12 | Q4'12 |
| Mine | 670.6 | 723.7 | 744.7 | 707.8 | 660.6 | 697.5 | 744.3 | 725.3 |
| Recycled Gold | 358.2 | 413.9 | 468.5 | 427.9 | 382.5 | 387.5 | 447.7 | 407.9 |
| Total Supply | 1,028.8 | 1,137.6 | 1,213.2 | 1,135.7 | 1,043.1 | 1,085.0 | 1,192.1 | 1,133.2 |
The total global gold supply was recorded to be 4,516.5t for 2011 and 4,453.3t for 2012, and it is estimated to rise slightly to 4,631t for 2013.
After a pause in mine production, the supply has been increasing slightly in 2013. In 2012, the figure was 2,847.7t — 9% above the 5-year average of 2,614.0t.
The 2013 figure is estimated to be 2,917t, a 2.4% increase. The supply from recycled gold has been going through a declining trend for six consecutive quarters.
This supply tallied 1,668.5t for 2011 and 1,625.6t for 2012, and could drop to 1,397t for 2013.
In addition, the total supply in 2013 includes a new supply from the liquidation of ETF gold holdings — an estimate of 213t.
Total Demand
In recent years, the annual global consumption of gold is about: 40-50% in jewellery, 35-40% in investments, 10-15% in bank reserves, and 10% in industries.
Currently, the global demands are strong, though the regional percentages has been shifting from west countries to east
— Middle East, Turkey, South East Asia, India and China.
Purchases from China and India now represent about 51-57% of the global total demand, each consumes an almost equal amount of gold annually.
Nevertheless, the Indian government has recently imposed restriction on gold imports in 2012 and 2013 to control their current account balance. From
latest WGC report, India bought 714.7t while China bought 779.6t so far this year. By the end of this year, China is likely to have consumed 1,000t
(a 7% increase from 2012's 832.18t), exceeding Indian total. Therefore, China would be confirmed as the largest consumer of gold in the world.
From the breakdown of the following tables, Q1-2013 to Q3-2013,
global consumers bought 1,645t of gold jewellery, investors bought 1,252t of bars and coins, various industries bought
309t, while the central banks still increased their gold reserves by buying about 297t from the open market.
However, the gold ETFs sold 697t this year (Tables 5 & 6).
| 2011 | 2012 | Q4'12 | Q1'13 | Q2'13 | Q3'13 | |
| Jewellery | 1,975.1 | 1,896.1 | 523.4 | 554.8 | 603.0 | 486.7 |
| Technology | 451.7 | 407.5 | 96.2 | 102.4 | 104.0 | 102.8 |
| Investment | 1,703.8 | 1,535.5 | 425.4 | 240.0 | 129.0 | 185.5 |
| Bars & Coins | 1,518.7 | 1,256.4 | 337.3 | 416.5 | 531.3 | 304.2 |
| ETFs | 185.1 | 279.1 | 88.1 | -176.5 | -402.2 | -118.7 |
| Official Sector | 456.8 | 544.1 | 150.4 | 124.2 | 79.3 | 93.4 |
| Total Demand | 4,587.4 | 4,383.2 | 1,195.3 | 1,021.3 | 915.3 | 868.5 | London Gold Price, $/oz | 1,571.5 | 1,669.0 | 1,721.8 | 1,631.8 | 1,414.8 | 1,326.3 |
Table 6. Gold Demand (US$millions)
| 2011 | 2012 | Q4'12 | Q1'13 | Q2'13 | Q3'13 | |
| Jewellery | 99,794 | 101,745 | 28,972 | 29,104 | 27,427 | 20,754 |
| Technology | 22,823 | 21,865 | 5,325 | 5,372 | 4,731 | 4,385 |
| Investment | 86,085 | 82,393 | 23,549 | 12,591 | 5,869 | 7,912 |
| Bars & Coins | 76,735 | 67,418 | 18,670 | 21,852 | 24,166 | 12,972 |
| ETFs | 9,350 | 14,975 | 4,879 | -9,261 | -18,297 | -5,060 |
| Official Sector | 23,081 | 29,193 | 8,323 | 6,515 | 3,606 | 3,983 |
| Total Demand | 231,783 | 235,196 | 66,170 | 53,581 | 41,633 | 37,035 | London Gold Price, $/oz | 1,571.5 | 1,669.0 | 1,721.8 | 1,631.8 | 1,414.8 | 1,326.3 |
India has been the largest buyer of gold; it imports more than 800t of raw gold and gold jewllery. China was second on the list and also imported fabricated gold products. Table 7 shows the other big buyers on the list.
| Country | 2009 | 2010 | 2011 | 2012 |
| India | 442.37 | 745.70 | 986.3 | 864.0 |
| Greater China | 376.96 | 428.00 | 921.5 | 817.5 |
| U.S.A. | 150.28 | 128.61 | 199.5 | 161.0 |
| Turkey | 75.16 | 74.07 | 143.0 | 118.0 |
| Saudi Arabia | 77.75 | 72.95 | 69.1 | 58.5 |
| Russia | 60.12 | 67.50 | 76.7 | 81.9 |
| United Arab Emirates | 67.60 | 63.37 | 60.9 | 58.1 |
| Egypt | 56.68 | 53.43 | 36.0 | 47.8 |
| Indonesia | 41.00 | 32.75 | 55.00 | 52.3 |
| United Kingdom | 31.75 | 27.35 | 22.6 | 21.1 |
| Japan | 21.85 | 18.50 | -30.1 | 7.6 |
| South Korea | 18.83 | 15.87 | 15.5 | 12.1 |
| Vietnam | 15.08 | 14.36 | 100.8 | 77.0 |
| Thailand | 7.33 | 6.28 | 107.4 | 80.9 |
| Other Countries | 275.70 | 275.97 | 412.4 | 413.4 |
| Total | 1,718.46 | 2,024.71 | 3,176.6 | 2,871.2 |
| (cf. WGC data) | 1,819 | 2,017 | 1,975 | 1,896 |
Outlook
With a supply-and-demand perspective, physical gold are still sought by consumers and investors. As a matter, the tonnage has increased
in response to the drop of market price. At the same time, the supply from mine production is still able to fill the demand even though the production costs
have been rising because of environmental concerns and local unrests. Nevertheless, the slide of gold price could delay the start-up of new mines and
close any unprofitable mines or new projects.
The rate of the supply by scrap gold has been slowed, also in response to the drop of
the gold price. In 2013, the central banks are still purchasing gold from the market even though the rate has been slowed in recent quarters.
The Exchange-traded funds now acted strange, with massive outflow and the corresponding large losses this year. According to Marcus Grubb, the managing director
for investment of World Gold Council, said that most of ETF selling had already happened and the slide was likely to slow in Q4 of 2013.
At this writing, the London gold price reached the lowest level of US$1,243 per troy ounce from the peak of 2011.
One reason why gold stumbles is that gold price is inversely correlated to the US dollar. With the gradual recovery of US and global economies, the US dollar has been strengthening.
Furthermore, inflation in most industrialized countries is at the lowest level of 1% in 36 years or so. The inflation rate is anticipated to be low as well at least for 2014.
Gold is often considered a hedge against inflation. As inflation remains low for a while, gold investors might seek more profitable opportunities elsewhere,
for example stocks or short-term securities. Of course, if the central governments are not able to keep on the track in trimming their large debts or they increase
the future hike of interest rate too rapid, the gold price might advance again as a safe haven against monetary uncertainties.
Notes
1.Conversion of unit - one metric tonne (t) = 1,000 kg = 32,150.7 troy ounce.2. All-in sustaining cost - A new measure of gold production (AISC)). It provides a more comprehensive look at costs than the traditional cash cost approach, as it includes operating costs, general and administrative costs, rehabilitation (accretion and amortization), mine on-site exploration and evaluation costs, mine development expenditures, and sustaining capital expenditures.
3. Adjusted operating cost - It includes direct mining costs, gain/loss on currency hedge and commodity hedge contracts, by-product credits, royalties and other costs.